HELP!
How do I monitor the performance of my decision knowledge?
Each time a deployed Viabl Platform application is run, it generates a special format runtime session "trace" string that can be used to trace the path of inference taken by the inference engine within the Viabl Platform. This can be a powerful debugging tool for checking the application logic. It is also possible to record the trace strings for all your runtime Sessions to see how often the various knowledge objects are firing by bringing these sessions back into the development platform.
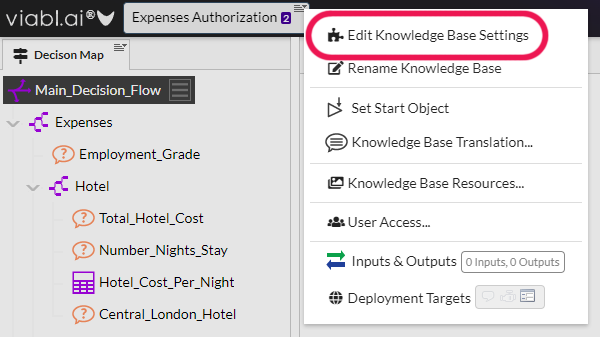
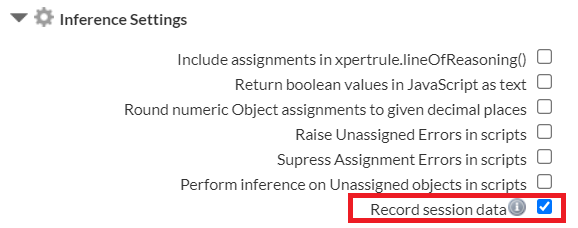
- Select the "Record session data" options in knowledge base Settings (under Inference).
- Deploy and Run your application to generate runtime sessions.
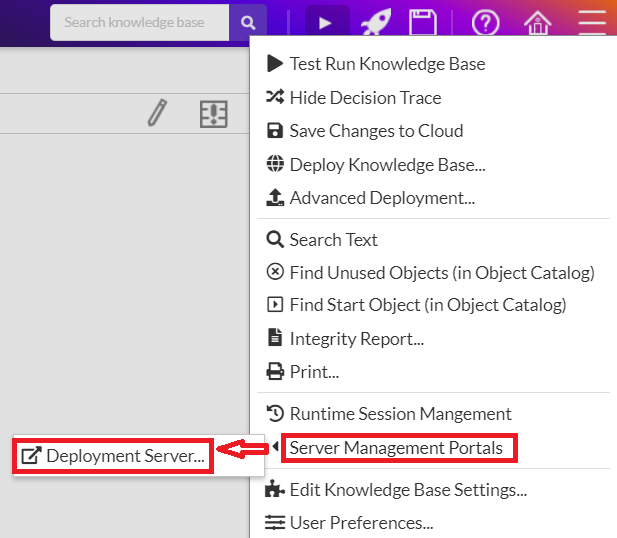
- Access the relevant deployment server Portal (Chat, Dialog, Silent) from the right-hand burger menu...
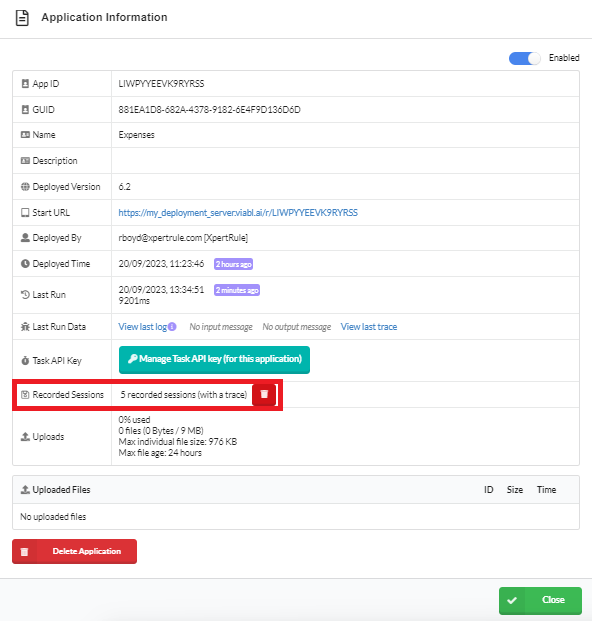
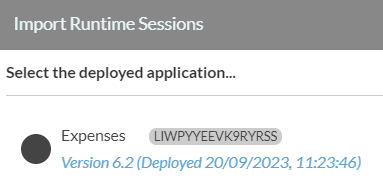
and click the deployed application...
to view the number of sessions recorded for that application.
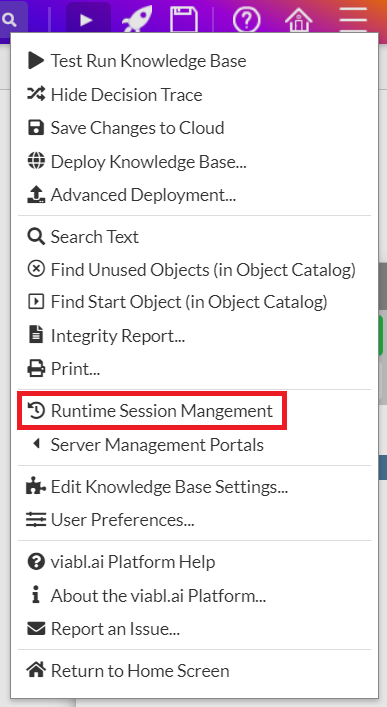
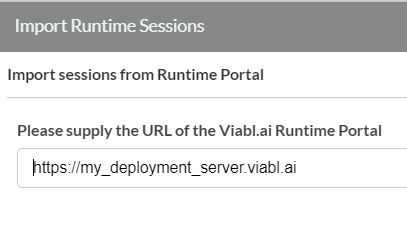
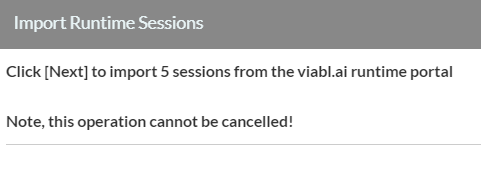
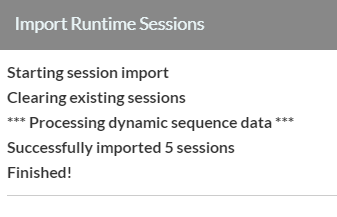
- Back in the Viabl Platform select the "Runtime Session Management" option from the right-hand burger menu to import the session data.
For example...
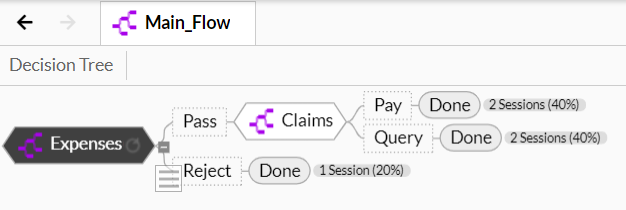
- View the session stats shown in your Viabl.ai Platform Knowledge Object editors.
